
How to Look Up Arlington County Jail Population Data
Population data comes from official county sources, not a public dashboard. The Sheriff's Corrections Division page lists a current daily average, and the annual report gives a fuller yearly picture. For national context, the U.S. Bureau of Justice Statistics and the Vera Institute publish jail data across the country.
The clearest recent source is the Sheriff's yearly report. The 2024 Annual Report release reports a daily average population and a set of program and operations figures.
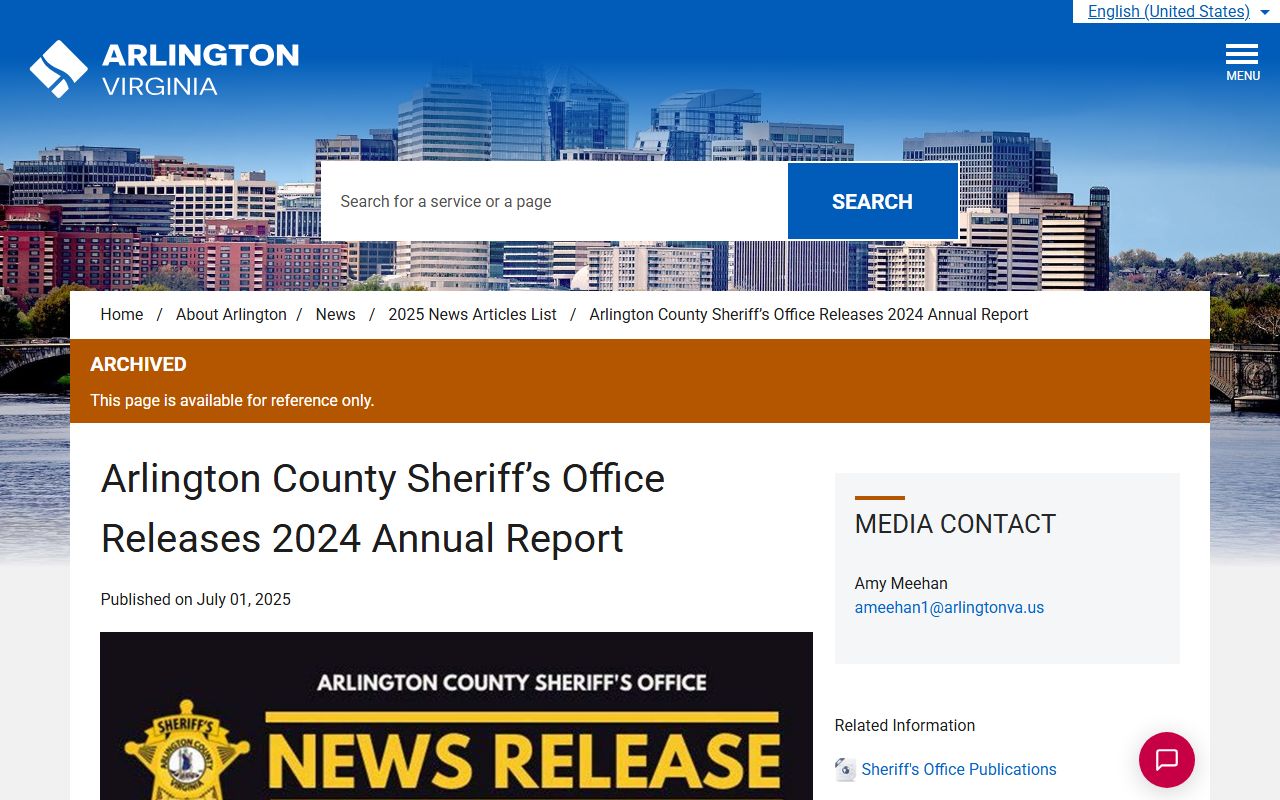
It is the most detailed official snapshot of the jail's size and programs in one place.
Arlington County Jail Capacity Overview
All county inmates are held at one site, the Arlington County Detention Facility at 1435 North Courthouse Road. It is a high-rise, direct-supervision jail, which means deputies are stationed inside housing units rather than watching from a booth. The facility holds several custody levels to manage behavior and risk, and it is accredited by the American Correctional Association.
| Facility | Official Capacity | Daily Average | Notes |
|---|---|---|---|
| Arlington County Detention Facility | Not published by the county | 327 current; 364 in 2024 | Direct supervision, high-rise, ACA accredited, PREA adherent |
The model itself shapes how the population is managed. The Sheriff describes the jail as the first urban high-rise jail run under direct supervision in Virginia, and one of the most technically advanced in the country. Officials from around the world have come to study it. In 2023, the office added GUARDIAN RFID tracking to improve inmate accountability and service delivery, which gives staff better real-time data on the people in custody.
Note: the county's official pages do not publish a current rated capacity, so capacity figures should be confirmed with the Sheriff's Office before being relied on.
Average Daily Population
The most useful single number is the average daily population, or ADP. It smooths out the daily swings of bookings and releases. Arlington's recent official figures sit in the low-to-mid 300s. The Corrections Division page lists an average of 327 inmates housed daily. The 2024 annual report puts the daily average at 364 for that year.
A live snapshot of the inmate query once showed 329 people in custody. These figures are close enough to give a reliable range, even though they come from different dates and sources. Treat the ADP as a band, roughly 300 to 365, rather than one exact count.
The gap between the numbers is normal. A current page may show a recent average, while an annual report averages a full year that includes higher and lower months. A single live query is just one moment in time. None of these is wrong. They simply measure the same jail at different scales, which is why a band is more honest than a single headline figure.
Population Composition in Arlington County
The jail holds a mix of people and charges. Offenses range from petty larceny and check fraud to first-degree murder. The facility uses several custody levels to separate and manage that range. A notable Arlington detail is that many people held at the jail are not county residents. They are people arrested in the jurisdiction.
That pattern fits Arlington's geography. The county packs dense urban corridors, federal facilities, major transit routes, and Reagan National Airport into less than 26 square miles. A precise demographic breakdown by age, race, and sex is not published on the county's public pages, so any such figures should come straight from the Sheriff.
Pretrial vs Sentenced Population
A jail population is not one group. It blends people held before trial, people serving short local sentences, and people moving through programs or supervision. Pretrial detainees are held while their cases are pending and have not been convicted.
Arlington's public materials do not break out an exact pretrial-to-sentenced split. What the county does report is strong pretrial supervision results. In 2024, pretrial supervision posted an 87 percent success rate, which points to active use of release-with-conditions instead of detention for eligible people.
Misdemeanor vs Felony Population
Charge level also varies widely across the jail. Some people are held on misdemeanors, while others face serious felonies. The same facility houses both ends of that range, from minor property charges to the most serious violent charges.
Because charge data is tied to individual cases, the county does not post a jail-wide misdemeanor-versus-felony count. To see the charge on any one case, the Arlington County court records systems show the charge and disposition.
Mental Health and Medical Population
A share of the jail population needs medical or behavioral health care. The county Jail Mental Health Team partners with the Sheriff to serve people with mental health needs. In November 2025, the Sheriff's Office took over jail medical care directly, ending reliance on a private contractor for operations.
Dr. Richard Malish leads the new model as Chief Medical Director. The medical services transition release describes the staffing and the plan to seek national correctional health accreditation.
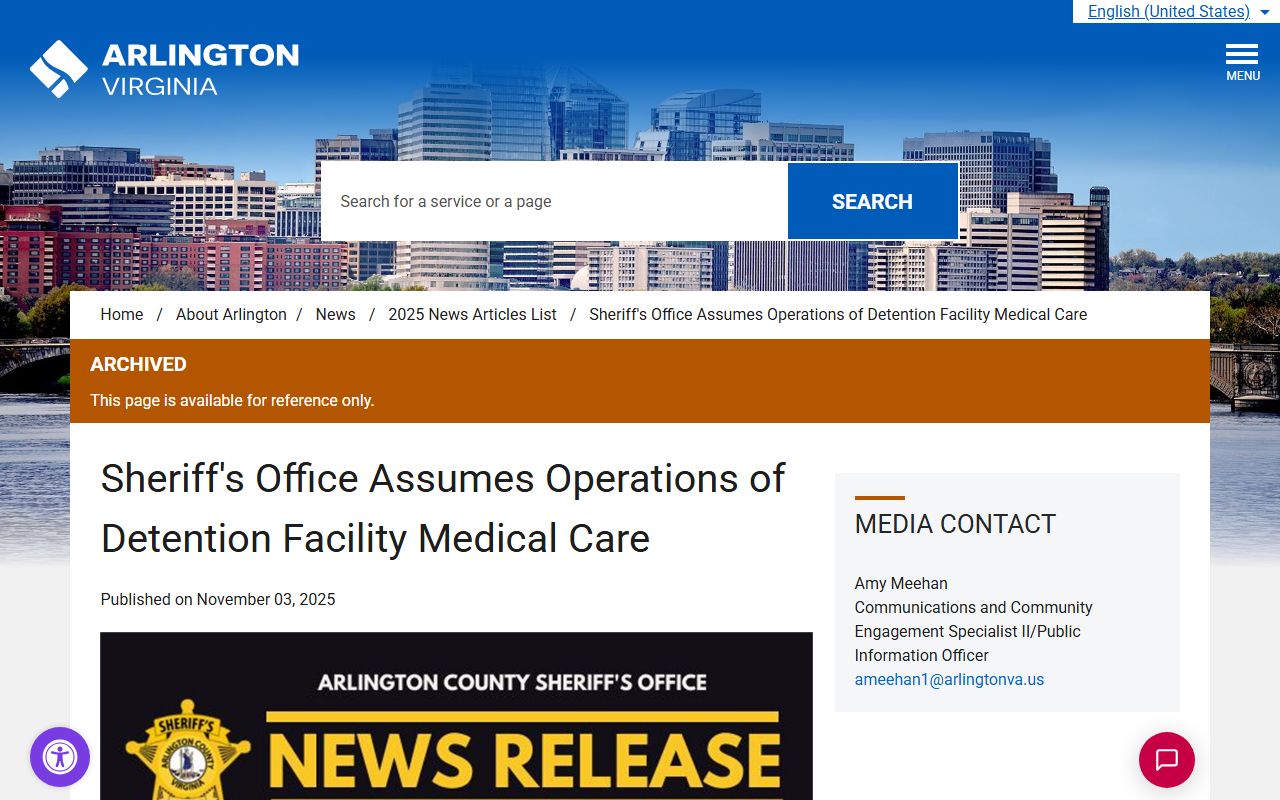
The shift is meant to make correctional healthcare directly accountable to the county.
Programs That Affect Jail Population
Programs shape who stays in the jail and for how long. Arlington runs treatment, reentry, and supervision efforts aimed at cutting repeat bookings. These efforts move people out of custody and try to keep them from returning.
- Pretrial supervision, with an 87 percent success rate in 2024.
- The Addictions, Corrections, and Treatment program, with 16 graduates in 2024.
- Medication Assisted Treatment, expanded with the addition of Sublocade.
- The Community Readiness Unit, focused on reducing recidivism.
- Biometric monitoring devices credited with 11 life-saving interventions.
The Sheriff frames these as both safety and population tools. Fewer repeat bookings means a smaller long-term population.
National and State Context
Local jail numbers make more sense next to national data. The U.S. Bureau of Justice Statistics tracks jail populations and incarceration rates nationwide. The Vera Institute publishes county-level jail data and trends. Both are standard reference points for comparing a single county to state and national figures.
Arlington's ADP in the low-to-mid 300s is modest for a populous, urban jurisdiction of about 243,760 residents. The county does not publish its own rate per 100,000 on its public pages, so a precise rate comparison should be drawn from BJS or Vera data rather than estimated here.
Arlington County Jail Population Trends
Tracking the figures over time shows a fairly steady jail. Official county snapshots have mostly landed in the 300 to 365 range across recent years. A full multi-year table is not posted in plain text on the county site, so the figures below come from the dated sources located.
| Source | Reported Average Daily Population |
|---|---|
| 2023 Sheriff technology release | About 300 |
| Current Corrections Division page | 327 |
| 2024 Annual Report | 364 |
| Live inmate query sample | 329 current records |
The trend reads as stable rather than sharply rising or falling. For exact year-over-year charts, the annual report PDF is the source to mine.
Searching for Arlington County Inmate Records by Name
These figures are population data, not an individual lookup. To find one person in custody, use the Sheriff's inmate query. The Arlington County inmate records page covers the name search and what each profile shows.
Where the Population Data Comes From
Every figure here traces to an official county source. The daily average comes from the Sheriff's Corrections Division page and the 2024 annual report. The custody model and accreditation come from the same office. National comparisons come from the Bureau of Justice Statistics and the Vera Institute. No number is estimated where the county has not published one, and gaps are marked as gaps rather than filled in with guesses.
Note: Jail population figures change daily, so confirm current counts with the Sheriff's Office before citing a specific number.
For release tracking and custody alerts, the released inmates page covers VINELink and the state and federal locators. For the booking side, see arrest records.